

REPORT: Nearly 30 Percent Of The Population In These Major U.S. Cities Are Immigrants
GATEWAY PUNDIT | By Alicia Powe | July 22, 2022
As unvetted illegal immigrants flood into the country at an unprecedented rate, the U.S. population is increasingly being replaced by migrants.
In large cities, immigrants comprise more nearly half of the population, according to a new report published by Background Checks, an online database for Public Records.
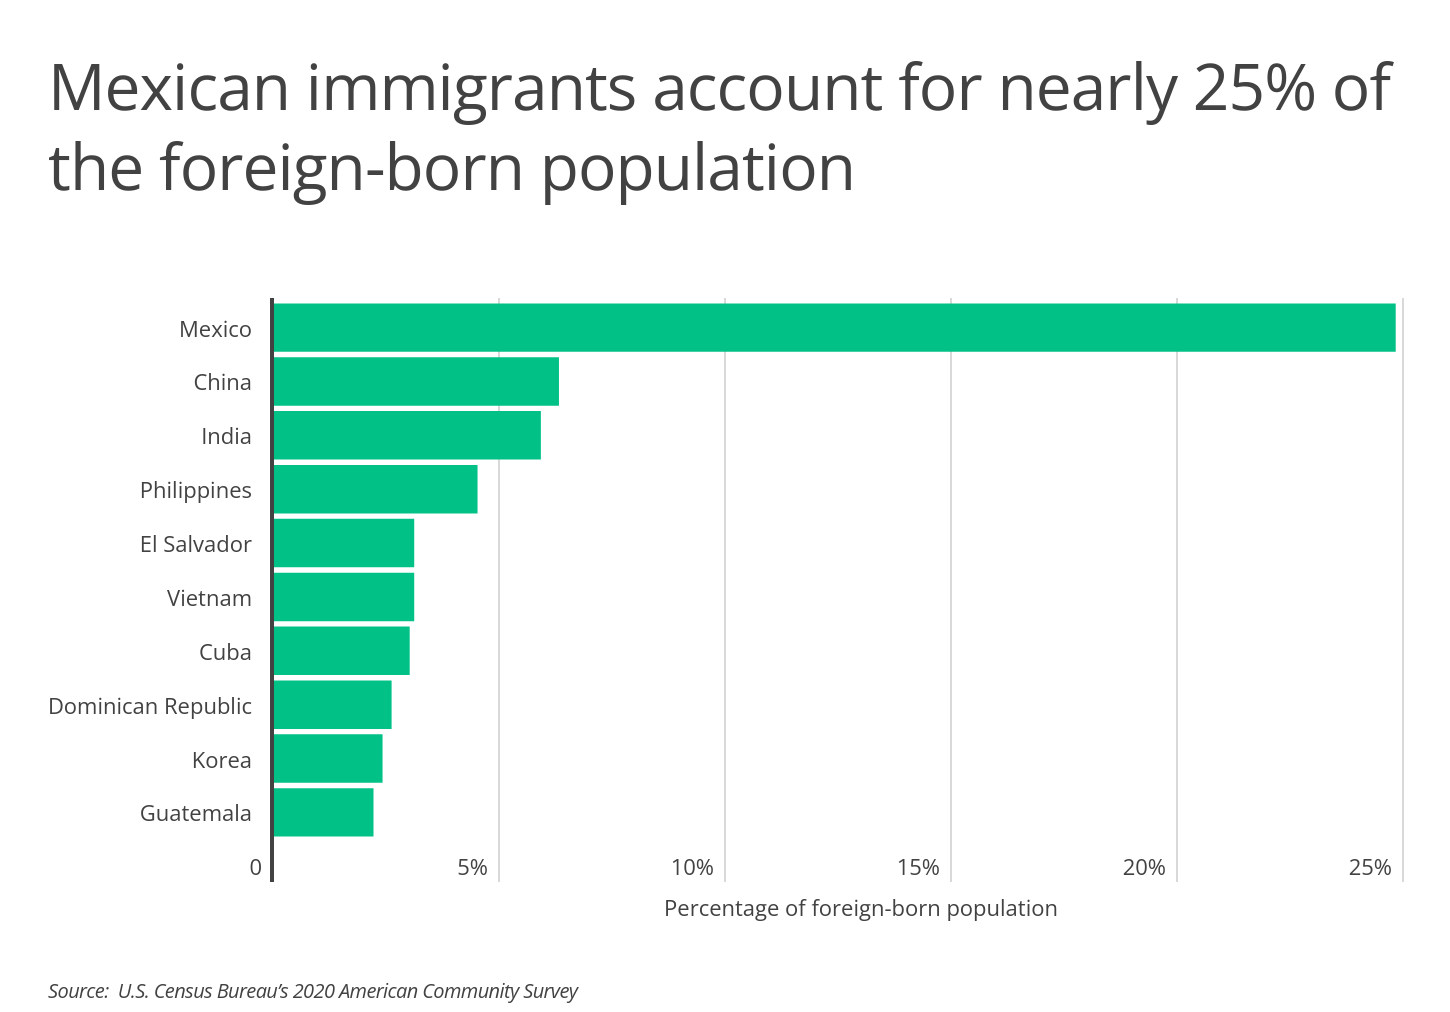
“With a foreign-born population of more than 44 million, the US has the largest number of migrants in the world,” the report states. “While U.S. immigrants come from almost every country in the world, Mexico is the most common country of origin for the foreign-born population.”
Researchers at the Background Checks analyzed data from the U.S. Census Bureau’s 2020 American Community Survey and the Pew Research Center to determine the U.S. metropolitan area with the largest population.
“Accounting for 24.8% of the foreign-born population, Mexico claims the largest number of U.S. immigrants. The Chinese and Indian immigrant populations are also large, making up a collective 12.2% of the foreign-born population,” the publication notes. “Pew Research Center analysis of Census Bureau data shows that about one million immigrants arrive in the U.S. each year, and the most common region for new immigrants is now Asia, which recently surpassed Hispanic countries.”
Immigrants currently comprise 13.7 percent of the population, but in large cities, nearly 50 percent of the population are migrants.
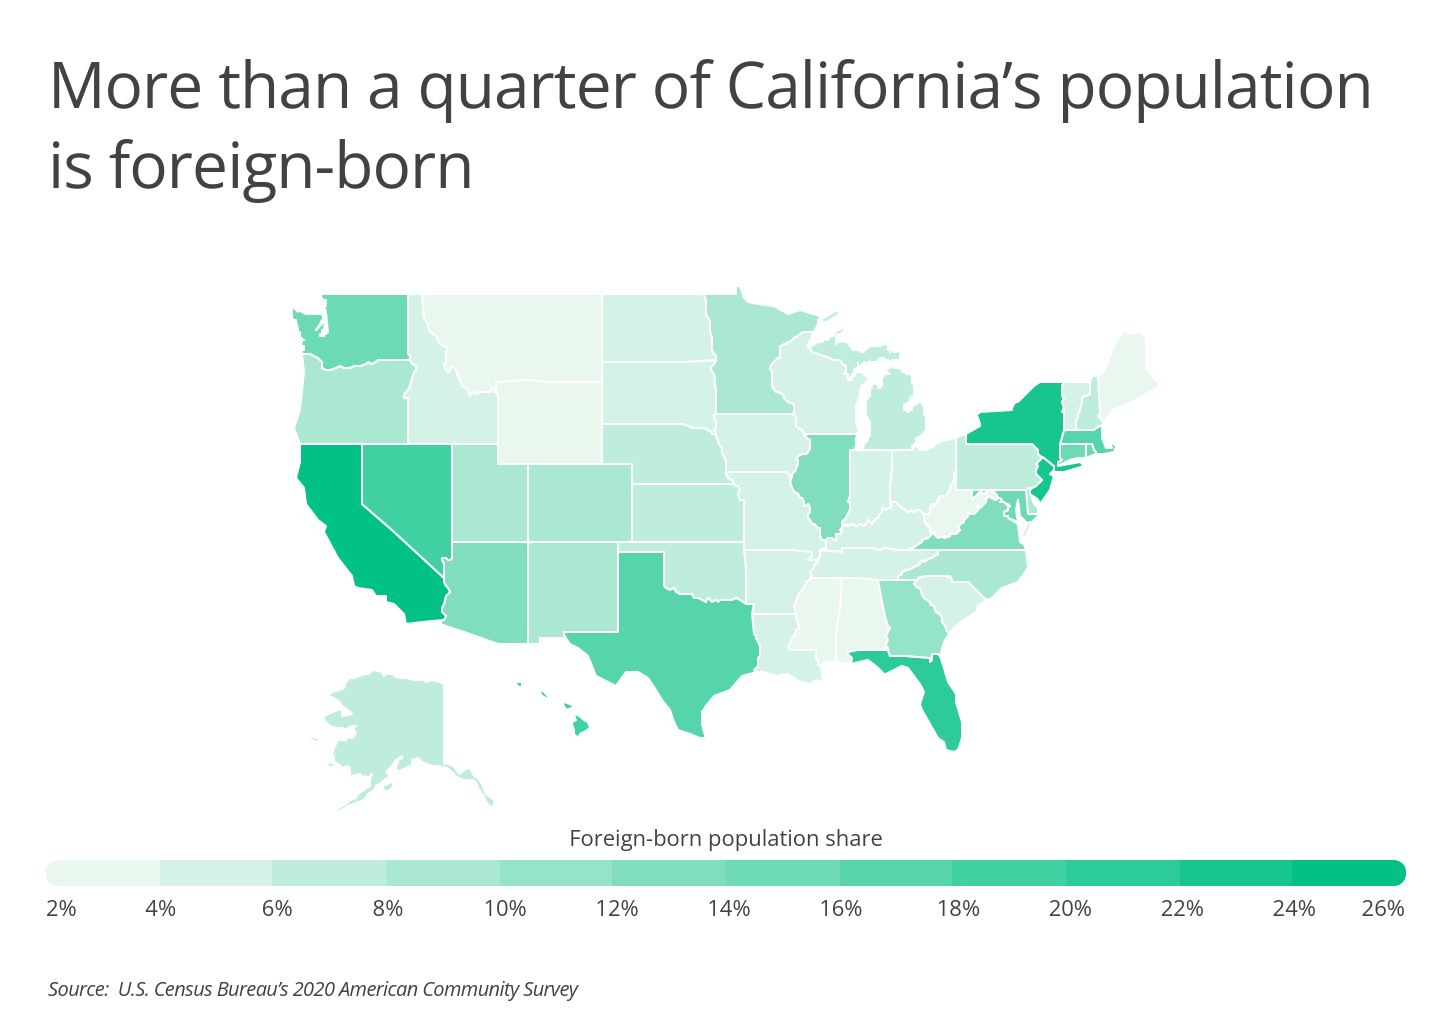
Over a quarter of California’s population is foreign-born, according to the analysis.
“While immigrants live in every U.S. state, some parts of the country have larger foreign-born populations than others. Over one-fourth of California’s population is foreign-born—mostly coming from Mexico—making California the top state for immigrants. New Jersey and New York also have large immigrant populations, with 22.7% and 22.4% of their populations being immigrants, respectively. Alternatively, Montana and West Virginia have very small immigrant populations, accounting for just 2.2% and 1.6% of their populations, respectively.”
Background Checks compiled a list of U.S. cities with the most migrants:
15. Sacramento-Roseville-Folsom, CA
- Foreign-born population share: 18.5%
- Most common country of origin: Mexico
- Total foreign-born population: 432,837
- Total population: 2,338,866
14. Dallas-Fort Worth-Arlington, TX
- Foreign-born population share: 18.5%
- Most common country of origin: Mexico
- Total foreign-born population: 1,376,117
- Total population: 7,451,858
13. Orlando-Kissimmee-Sanford, FL
- Foreign-born population share: 18.8%
- Most common country of origin: Colombia
- Total foreign-born population: 481,158
- Total population: 2,560,260
12. Boston-Cambridge-Newton, MA-NH
- Foreign-born population share: 18.9%
- Most common country of origin: China
- Total foreign-born population: 918,197
- Total population: 4,854,808
11. Seattle-Tacoma-Bellevue, WA
- Foreign-born population share: 19.2%
- Most common country of origin: Mexico
- Total foreign-born population: 754,455
- Total population: 3,928,498
10. Riverside-San Bernardino-Ontario, CA
- Foreign-born population share: 21.1%
- Most common country of origin: Mexico
- Total foreign-born population: 970,476
- Total population: 4,600,396
9. Las Vegas-Henderson-Paradise, NV
- Foreign-born population share: 22.1%
- Most common country of origin: Mexico
- Total foreign-born population: 492,617
- Total population: 2,228,866
8. Washington-Arlington-Alexandria, DC-VA-MD-WV
- Foreign-born population share: 22.8%
- Most common country of origin: El Salvador
- Total foreign-born population: 1,425,904
- Total population: 6,250,309
7. San Diego-Chula Vista-Carlsbad, CA
- Foreign-born population share: 22.9%
- Most common country of origin: Mexico
- Total foreign-born population: 762,260
- Total population: 3,323,970
6. Houston-The Woodlands-Sugar Land, TX
- Foreign-born population share: 23.3%
- Most common country of origin: Mexico
- Total foreign-born population: 1,623,239
- Total population: 6,979,613
5. New York-Newark-Jersey City, NY-NJ-PA
- Foreign-born population share: 29.3%
- Most common country of origin: Dominican Republic
- Total foreign-born population: 5,652,129
- Total population: 19,261,570
4. San Francisco-Oakland-Berkeley, CA
- Foreign-born population share: 30.7%
- Most common country of origin: China
- Total foreign-born population: 1,443,907
- Total population: 4,709,220
Los Angeles-Long Beach-Anaheim, CA
- Foreign-born population share: 32.7%
- Most common country of origin: Mexico
- Total foreign-born population: 4,325,660
- Total population: 13,211,027
2. San Jose-Sunnyvale-Santa Clara, CA
- Foreign-born population share: 39.1%
- Most common country of origin: China
- Total foreign-born population: 775,944
- Total population: 1,985,926
1. Miami-Fort Lauderdale-Pompano Beach, FL
- Foreign-born population share: 40.9%
- Most common country of origin: Cuba
- Total foreign-born population: 2,504,666
- Total population: 6,129,858
Immigrants comprise less than a quarter of the population (13.7 percent), according to Background Check’s analysis, but it does not take into account the portion of undocumented immigrants residing in the U.S.
According to a 2017 Pew Research Center survey, “unauthorized immigrants” comprise “almost a quarter of U.S. foreign-born population.”